A guide to following the National Hurricane Center
posted by Jeff | Monday, August 28, 2023, 8:30 PM | comments: 0Having grownup in the Midwest, I vividly recall the obnoxious weather coverage by local weather dudes (it was always dudes) whenever the summer weather would get severe. At some point, having a crawl on the screen showing which counties had watches and warnings was not enough. With even the most subtle hint of a possible tornado on radar, they would break into programming and talk about it for hours. Keep in mind, tornadoes are ephemeral, lasting only a few minutes. Sometimes a line of storms will generate multiple tornadoes, and that's something to keep tabs on, but most of the time they do not.
Then I moved to Florida and saw what the local TV folks did for hurricanes, and I realized that weather coverage could reach an entirely new level. It wasn't just the idiots from The Weather Channel standing outside, this was like the Super Bowl, World Series, Stanley Cup and NBA Finals all at once to these so-called "meteorologists." Fortunately, there is a way to cut through all of the bullshit. Hurricanes are serious, and potentially dangerous, but you don't need drama.
The National Hurricane Center maintains a web site that does a pretty good job of forecasting and preparing people for a storm, depending on where the science takes them. It's fairly matter-of-fact, and not made dramatic. It is updated every six hours, at 5 and 11 Eastern, day and night, as a storm progresses. Once you get to know the products that they publish, you don't need the local TV idiots. Here's my guide.
To be clear, I am not an expert. However, I do find that the data, as presented and considered in aggregate, is useful for understanding what's going on. I would also editorialize that the time to prepare is not when a storm looks likely, it's early in the summer.
Watching the world
The home page of the NHC has a big old map that shows all of the current storms or potential storms. It's divided into three tabs, splitting the Pacific and one for the Atlantic. This is where you can see things forming early on, though admittedly, for your daily life, this isn't super useful. For us here on the Atlantic, systems pop up closer to Africa, and they come apart before they get even close. This happens in the Gulf of Mexico as well. These disturbances are marked with an "X," and clicking on them shows text about the system with the probability of them becoming legit storms in two and seven days.
Eventually, a system may be given a number, meaning it's organized enough to be a real storm, but still only a tropical depression. Once it reaches sustained winds of 38mph, it is considered a tropical storm, and it gets a name. At this point, all of the more interesting products are published. Again, this information is updated at least every six hours, at 5 and 11.
Now you have a named storm

There are a few things to look at, and some of it is more valuable than other parts. The forecast discussion is a wall of text that describes what the meteorologists have observed, and what their prediction models, uh, predict. That context is helpful because it tends to summarize what may happen, and also has a ton of nerdy science stuff. It always ends with the approximate position of the storm every 12 hours for the first three days, then the two after that, paired with wind speeds.
The cone of shame
The TV weather porn loves to show the cone, but often TV people explain it wrong, and the average person by extension doesn't understand what it means. There is actually text on the page that explains it, but it's small, and it obviously isn't shown on the tele.
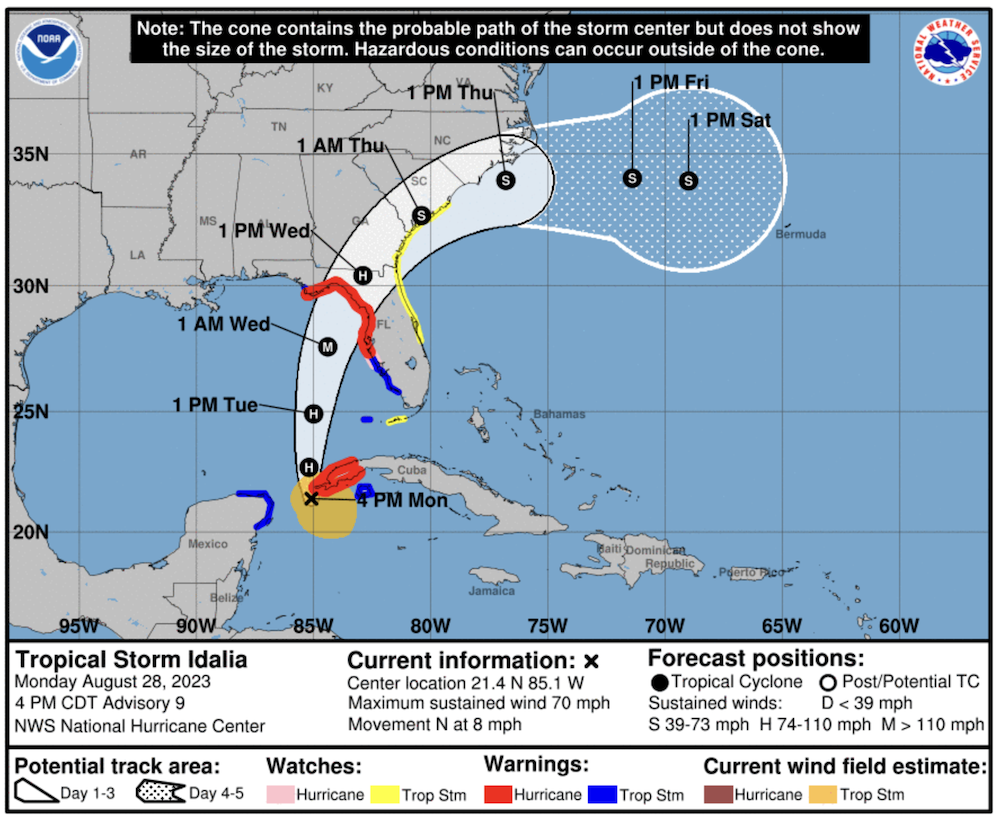
The first thing is that the cone is showing where the center of the storm is most likely to go in the next five days, with 60-70% certainty. The further away from its current position, the less precise one can be, so the cone is larger. What it does not show is the size of the storm or the areas likely be affected. This is just the area where the center of the storm might cross. A narrow cone only means the forecasters are more certain about where it's going. Storms can be hundreds of miles across, and in the case of Florida, potentially cover the entire state. Just because the cone isn't near where you live doesn't mean that you're in the clear. As the key on the graphic shows, the wind speed range is indicated by the letter at the center of the storm, but that can extend hundreds of miles in every direction, especially to the right front of the storm (more on that in a minute).
What time is it?
I really like the graphic that shows the arrival time for "tropical storm force" winds. This one is more interesting because it takes into account the size of the storm.
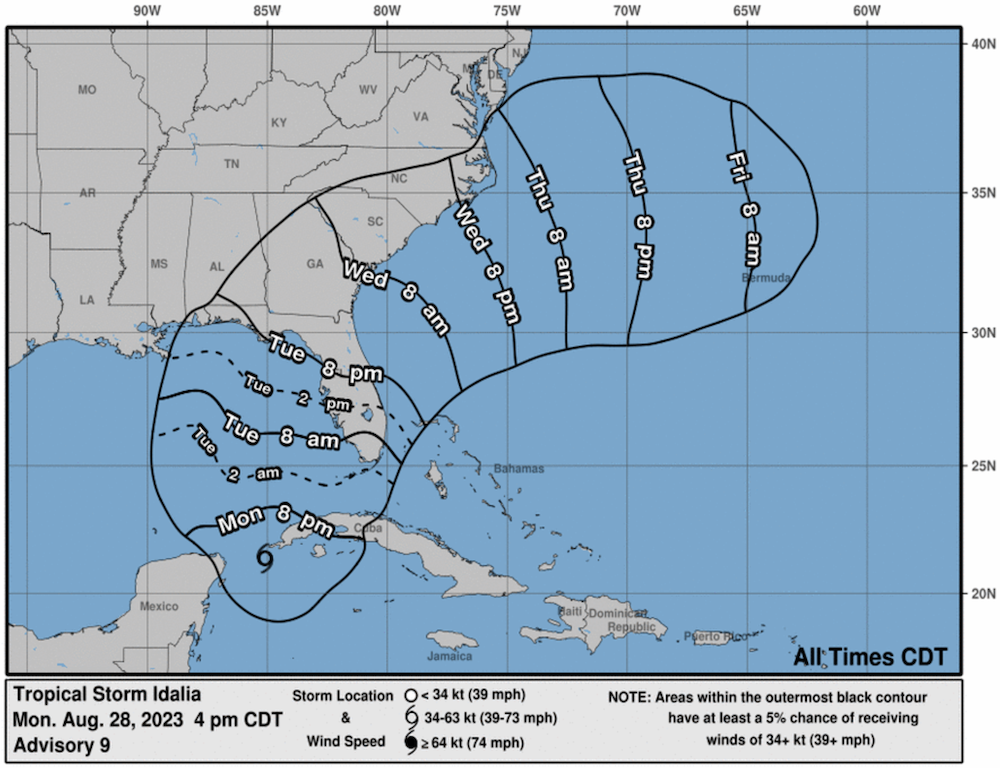
This product shows you when it's gonna start getting breezy, meaning that the time shows when wind that's at least 39 mph will blow through your hair. This doesn't really tell you anything about the severity of the storm, but it gives you scope. So combined with the cone, you can get a sense of when the storm will arrive, and how serious it will be.
Looking at the raw numbers
I understand numbers, and at least basic probability. For that you can turn to the windspeed probability chart to get a more fine-grained look at what you might expect. Here's an example:
               FROM    FROM    FROM    FROM    FROM    FROM    FROM
  TIME       18Z MON 06Z TUE 18Z TUE 06Z WED 18Z WED 18Z THU 18Z FRI
PERIODS         TO      TO      TO      TO      TO      TO      TO
             06Z TUE 18Z TUE 06Z WED 18Z WED 18Z THU 18Z FRI 18Z SAT

FORECAST HOUR    (12)   (24)    (36)    (48)    (72)    (96)   (120)
- - - - - - - - - - - - - - - - - - - - - - - - - - - - - - - - - -
TALLAHASSEE FL 34  X   X( X)   9( 9)  43(52)   1(53)   X(53)   X(53)
TALLAHASSEE FL 50  X   X( X)   1( 1)  24(25)   2(27)   X(27)   X(27)
TALLAHASSEE FL 64  X   X( X)   X( X)   9( 9)   X( 9)   X( 9)   X( 9)
First you need to find your closest city. There will be one to three lines, each one describing the probability of certain wind speeds over time. I don't know why they use knots here, and not mph, or even km/h, but for 'Merica, the three speeds they're looking at is 39, 58 and 74 mph. These bands correspond to a tropical storm, a more serious tropical storm and a hurricane. The sets of numbers then are a number of hours into the future, as described at the top with the number of hours, and the UTC time above that (again, why not use local time?).
The two numbers describe the onset probability, and the cumulative probability. Onset is at the time that you hit the hour described, while cumulative it the overall odds between now and then. I tend to look more at the cumulative, because the timing is less important in terms of preparation. An "X" means there's less than a 1% chance. So in the example above, 48 hours from that time, there's a 43% chance that Tallahassee will see tropical storm winds (39 mph or more), and a 52% chance overall. Similarly, the chance is 24% and 25% cumulative for 58 mph or more winds, which is a mid-range tropical storm. Hurricane force winds, 74 mph or more, only have a 9% chance at that point.
So there's a 1 in 4 chance that it's going to be awfully windy in Tallahassee in 48 hours, which to me at least seems pretty serious. Our chances here in Orlando are only 7% to reach that middle tier, so at this point, I'll wait and see if we really need to bring anything inside. Sustained wind is so weird to experience. I don't know if I'll ever get used to it.
OMG THE EYE IS COMING FOR YOU!
One of the more annoying things about the TV people is the emphasis for where the eye of the storm is. When the storm is over water, and the eye is well formed, the strongest winds are in fact in the thunderstorms circulating around the eye wall. When it comes ashore, that relative location is certainly important. But as more and more buildings are built to withstand hurricane winds, as modern building codes require, the emphasis on the eye is a distraction from the danger of the water. On the coast, it's the storm surge problem, where the water can get sucked away from the coast, and then pushed back inland and causing massive flooding.
But that eye emphasis is even worse when the storm is moving inland. The eye tends to fall apart pretty quickly over land, but TV idiots keep drawing a line over your neighborhood and tell you to "hunker down" because it's coming for you. The center of the storm at that point isn't really the thing to worry most about, and again, it's the water. The rain and flooding that you may endure is not confined to the center. In fact, the most dangerous areas are in the right front quadrant of the storm (in the northern hemisphere). This is true when it's coming ashore, in terms of surge and wind, and it's still true inland. That's where you're mostly likely to find tornadoes and the most serious storm cells. So for inland folks like me, I'm more interested in where I am relative to the storm's center, and how much the winds are persisting. We were on the right side of Irma, and there were far more trees down and roofs damaged compared to Ian, when we were left of the path. (I understand this is an anecdote, and all storms are not alike, but Ian was technically the stronger storm by a good margin, with less time weakening over land before it got to us compared to Irma.)
So that's how I look at the storms, and react accordingly. Amazingly, we've only had three "serious" storms here in Orlando in the last decade, and that's including Matthew in 2016, which stayed off-shore most of the way up the east coast (we were in North Carolina). Irma was the worst in terms of local wind damage, while Ian last year was "easier" for us, despite a lot of flooding in different areas around town. With the 5 pm update tonight, it looks like Idalia will be mostly a non-event for us, but pretty serious up in the panhandle and coastal cities.
Comments
No comments yet.