Awesome custom metrics using Azure Application Insights
posted by Jeff | Sunday, February 23, 2020, 7:35 PM | comments: 0You know that old management saying, that you can't improve what you don't measure? It's annoying because being measured feels personal and uncomfortable, but it's useful in technology because it's totally true. There is a fairly lucrative market around monitoring stuff in the cloud now, because as our systems become more distributed and less monolithic, we do less tracing at the code level and more digestion of interaction data between components.
When I launched the hosted forums, the big change was that I was finally exercising the two-level cache code that I wrote for POP Forums a long time ago. It was of course inspired by the way StackOverflow handles their caching. Basically, the web node checks to see if it has the object in its local memory, and if not, it goes to Redis. If it's not there either, then it goes to the database and puts it in Redis. Then, using Redis' pub/sub messaging, all of the web nodes get a copy and it holds on to it there with the same TTL. The default that I use is 90 seconds, but I don't know if that's "good" or not. I had no context or data to support that it worked at all, actually.
The first step for me was to plug in Azure Application Insights, because it's silly-easy to use. You add a NuGet package to your web app, a little Javascript to your pages, the app key to your configuration, and enjoy that sweet sweet stream of data in the Azure portal. Instantly I had this beautiful map of curvy lines going between databases and web apps and Azure functions and queues and... not Redis. OK, no problem, a little google-foo reveals that the SDK doesn't have the hooks to monitor Redis calls. So I wander through the Azure portal to my Redis instance, and look up the numbers there. What I find is that there are almost three times as many cache misses than hits, which implies that data isn't repeatedly fetched very often, or something else.
This is actually not super useful, because in theory, my two-level cache would not need to go all the way to Redis if the object is locally stored in the web node's memory. It's also not useful because I wanna see all of this in the pretty application maps!
OK, so with the underlying forum project being open source, I didn't want to bake in this instrumentation because I don't know what others are using. Not forcing them to use App Insights, I decided to wrap all of my cache calls in a simple start/stop interface, and wire in a default implementation that doesn't do anything. That way, a consumer can write their own and swap out the dependencies when they compose their DI container. For example, here's the code wrapping a write to the memory cache:
_cacheTelemetry.Start();
_cache.Set(key, value, options);
_cacheTelemetry.End(CacheTelemetryNames.SetMemory, key);
The _cache is an instance of IMemoryCache, and _cacheTelemetry is an instance of the interface I described above. One could argue that there are better ways to do this, and they're probably right. Ideally, since we're talking about something event based, having some kind of broader event based architecture would be neat. But that's how frameworks are born, and we're trying to be simple, so the default ICacheTelemetry is an implementation that does nothing.
In the hosted forum app, I use a fairly straightforward implementation. Let's take a look and then I'll explain how it works.
	public class WebCacheTelemetry : ICacheTelemetry
	{
		private readonly TelemetryClient _telemetryClient;
		private Stopwatch _stopwatch;

		public WebCacheTelemetry(TelemetryClient telemetryClient)
		{
			_telemetryClient = telemetryClient;
		}

		public void Start()
		{
			_stopwatch = new Stopwatch();
			_stopwatch.Start();
		}

		public void End(string eventName, string key)
		{
			_stopwatch.Stop();
			var dependencyTelemetry = new DependencyTelemetry();
			dependencyTelemetry.Name = "CacheOp-" + eventName;
			dependencyTelemetry.Properties.Add("Key", key);
			dependencyTelemetry.Duration = new TimeSpan(_stopwatch.ElapsedTicks);
			dependencyTelemetry.Type = "CacheOp";
			_telemetryClient.TrackDependency(dependencyTelemetry);
		}
	}
When you add Application Insights to your web project, you add services.AddApplicationInsightsTelemetry() to your Startup. Under the hood, this adds a shared instance of TelemetryClient to your DI container. This is what we use to pipe data back to Insights.
DANGER! A lot of the code samples in the SDK documentation show them creating new instances of the telemetry client with default configuration. This is naturally what I did first because I didn't read the documentation in any particular order. Something about this is bad, because my memory usage spiraled out of control until the app stopped responding. My theory is that it didn't have the right config, so it bottled up all of the events in memory and never flushed them, but I don't know for sure. Meh, using dependency injection is always better for testing anyway, so do that.
As shown earlier, the cache calls are wrapped in start and end calls, so all we're doing here is starting a timer, then stopping it and recording the cache event as a DependencyTelemetry object. For extra flavor, I'm recording the cache key as well, so if something is particularly slow, I can at least infer what the cached data was. For example, a key like "pointbuzz:PopForums.PostPages.17747" tells me that the tenant is "pointbuzz," and the rest says it's a bunch of posts from the topic with ID 17747.
I'm also giving the event a name that's prefixed with "CacheOp-" and not just the operation. Why? Because the lovely map view will group these together when they start with similar names. I learned this quite accidentally, because all of the database calls to tenant databases have a prefix on the database name. That worked out great because it groups the calls to tenant databases from the master database that describes the tenants.
Let's see some raw data! We can enter our Azure Insights in the portal, go to Logs, and query for the dependencies we said we would send:
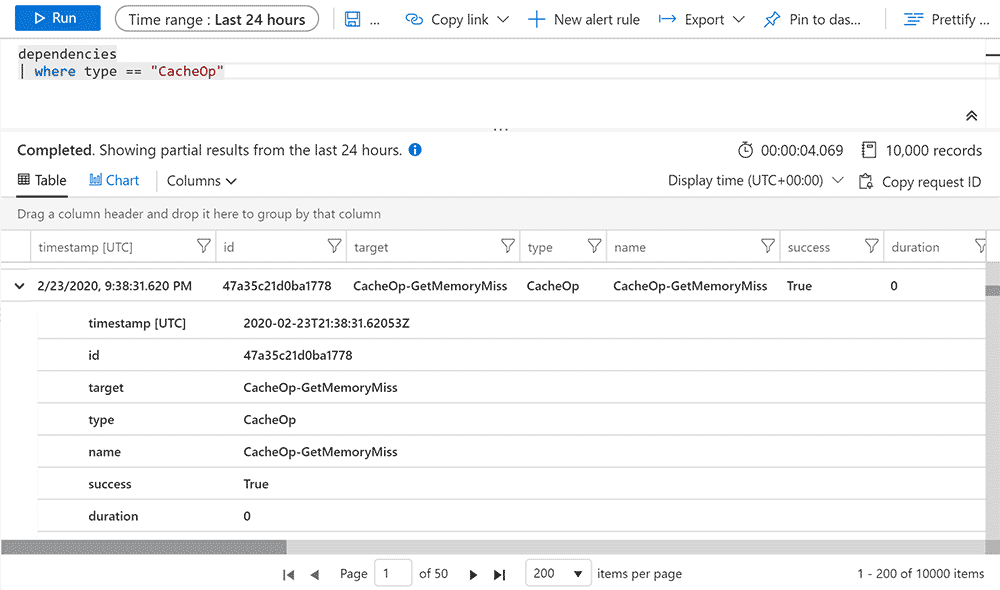
There's a ton of context in every one of these entries, because they all roll up to the request data from the user. So yeah, I find a lot of weird cache misses from Russian bots that I assume are trying to spam forum topics that are 10 years old.
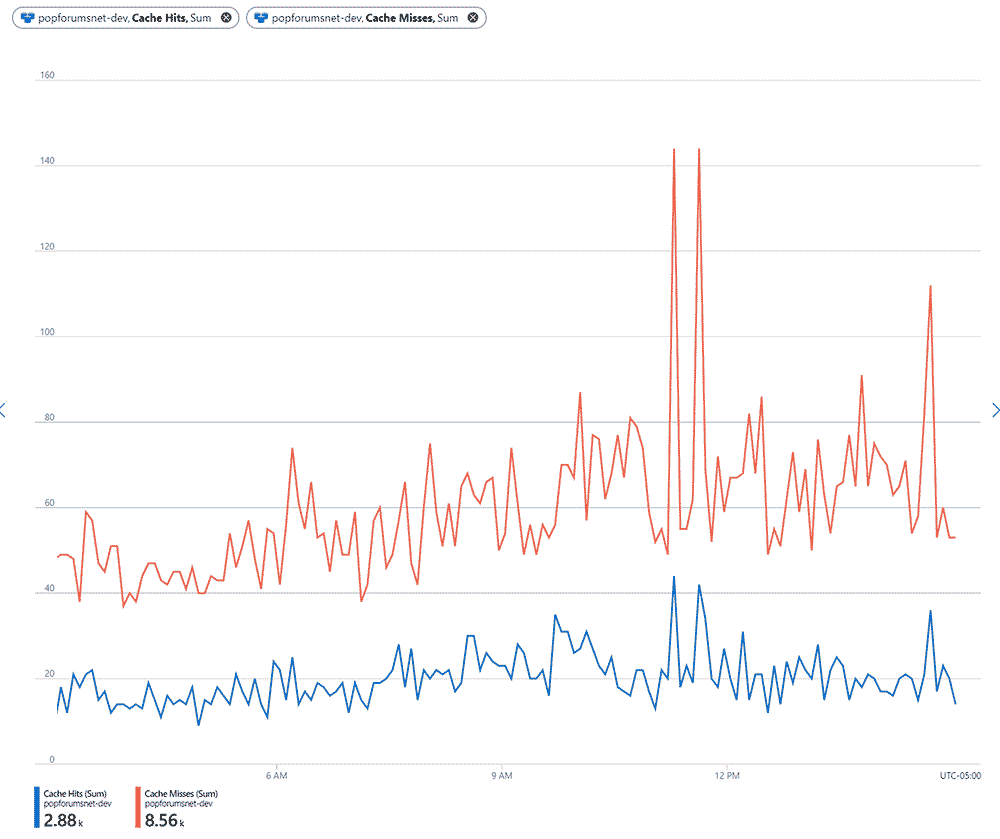
So that's cool, but remember that my original intent was understanding what the hit ratios were for the cache, for both in-memory and Redis. Well, we can write a query for that as well, and even pin it to a dashboard, if we so choose:

Behold! Useful data! This makes way more sense than my initial look at Redis data. It shows exactly what I would hope for, in fact: There are a ton of cache hits to the in-memory cache, and when those miss, they're persisted to memory and Redis. The bottom line is that the juicy data is right there in the memory most of the time. That's success! If you go back to the raw data above, you can see that those memory hits have a duration of zero, so less than a millisecond. That's obviously faster than crossing the wire to the database.
You can also get a good summary of what's going on, and track down slow hits, by going to the application map:

Right away, I wondered what the deal was with the slow gets from Redis. I'm still looking into it, but it looks like there's some overhead and warm up involved with the connection multiplexer in the StackExchange client. It's used so infrequently that there often isn't a connection to Redis established. That may partially explain why the SetRedis events are so short, because there had to be a connection to find there was nothing there before writing to it. It's all speculation at this point though, and generally pages are arriving in under 100ms.
Azure Application Insights is a very cool tool, and not limited to just the basics. It's important that your monitoring goes deeper, because the lesson I've learned time after time is that contextual monitoring is the thing that will save you. Nothing knows about the health of the system better than the system itself, so you should strive to have it tell you what's up (or down, as the case may be).
Comments
No comments yet.